你这是相当于对8个性状做主成分分析,如果要对300个样本的话,你的数据矩阵应该转置
R语言主成分分析
我的数据是果实在生长过程中测量性状,共测量8个性状,不同时间点测量共计8次,每次300个样品,请问这个如何做主成分分析。如果按照你的方法,做出来只是8个点。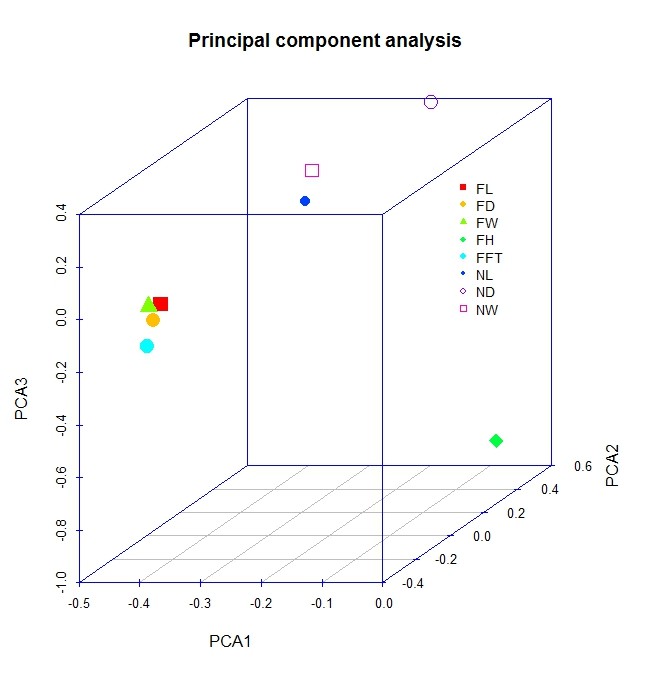
> cz<-read.table("x:/Yaping.Ma/cz.txt",header=TRUE,sep="\t")
> head(cz)
x1 x2 x3 x4 x5 x6 x7 x8
1 30.06 11.66 2.02 9.68 4.06 21.41 3.55 0
2 32.18 13.42 2.29 7.96 5.42 22.85 2.59 0
3 28.31 11.56 1.95 7.78 4.07 16.36 3.42 0
4 28.63 11.98 1.99 7.42 4.60 16.01 2.79 0
5 27.42 11.58 1.83 7.30 3.26 18.97 5.07 0
6 24.75 10.25 1.24 6.21 3.10 17.70 4.06 0
> pca1<-princomp(cz,cor=T)
> summary(pca1,loadings = T)
Importance of components:
Comp.1 Comp.2 Comp.3 Comp.4
Standard deviation 2.1585794 1.2076351 0.9174367 0.75943666
Proportion of Variance 0.5824331 0.1822978 0.1052113 0.07209301
Cumulative Proportion 0.5824331 0.7647309 0.8699422 0.94203521
Comp.5 Comp.6 Comp.7
Standard deviation 0.52737553 0.36470473 0.22931097
Proportion of Variance 0.03476562 0.01662619 0.00657294
Cumulative Proportion 0.97680083 0.99342702 0.99999996
Comp.8
Standard deviation 5.305783e-04
Proportion of Variance 3.518916e-08
Cumulative Proportion 1.000000e+00
Loadings:
Comp.1 Comp.2 Comp.3 Comp.4 Comp.5 Comp.6 Comp.7 Comp.8
x1 -0.424 -0.187 -0.247 0.819 -0.227
x2 -0.442 -0.169 -0.103 -0.167 -0.349 -0.323 -0.714
x3 -0.432 -0.233 -0.139 0.854
x4 0.496 -0.859
x5 -0.427 -0.258 -0.164 -0.347 -0.323 0.693
x6 -0.316 0.279 0.150 0.791 -0.366 -0.202
x7 -0.190 0.573 0.395 -0.554 -0.388 0.101
x8 -0.340 0.404 0.212 0.796 0.178
> library(scatterplot3d)
> PCA1=pca1$loadings[,1]
> PCA2=pca1$loadings[,2]
> PCA3=pca1$loadings[,3]
> colors=rainbow(24)
> s3d=scatterplot3d(PCA1,PCA2,PCA3
+ #, highlight.3d = TRUE
+ , col.axis = "blue",angle = 40,
+ color=colors[seq(1,24,3)], main = "Principal component analysis", pch = ' ')
> s3d$points(PCA1,PCA2, PCA3, pch =15:22,
+ cex = 2,col=colors[seq(1,24,3)])
> legend(s3d$xyz.convert(0.2, 0.2, -0.4), pch = 15:22, yjust=0,
+ legend =colnames(cz), cex = .7,col=colors[seq(1,24,3)],bty="n")